Facebook
 X
X
 Pinterest
 Copy Link

 With a healthy increase in inventory since May, the need for buyers to have all their down payment funds immediately available, and a willingness to make offers with no contingencies has passed in most cases. It has been quite a relief, and is providing opportunities for many folks that have wanted to cash in on their well-developed equity levels, and either move up to a bigger home or down size (right size) to a home that better fits their current lifestyle.
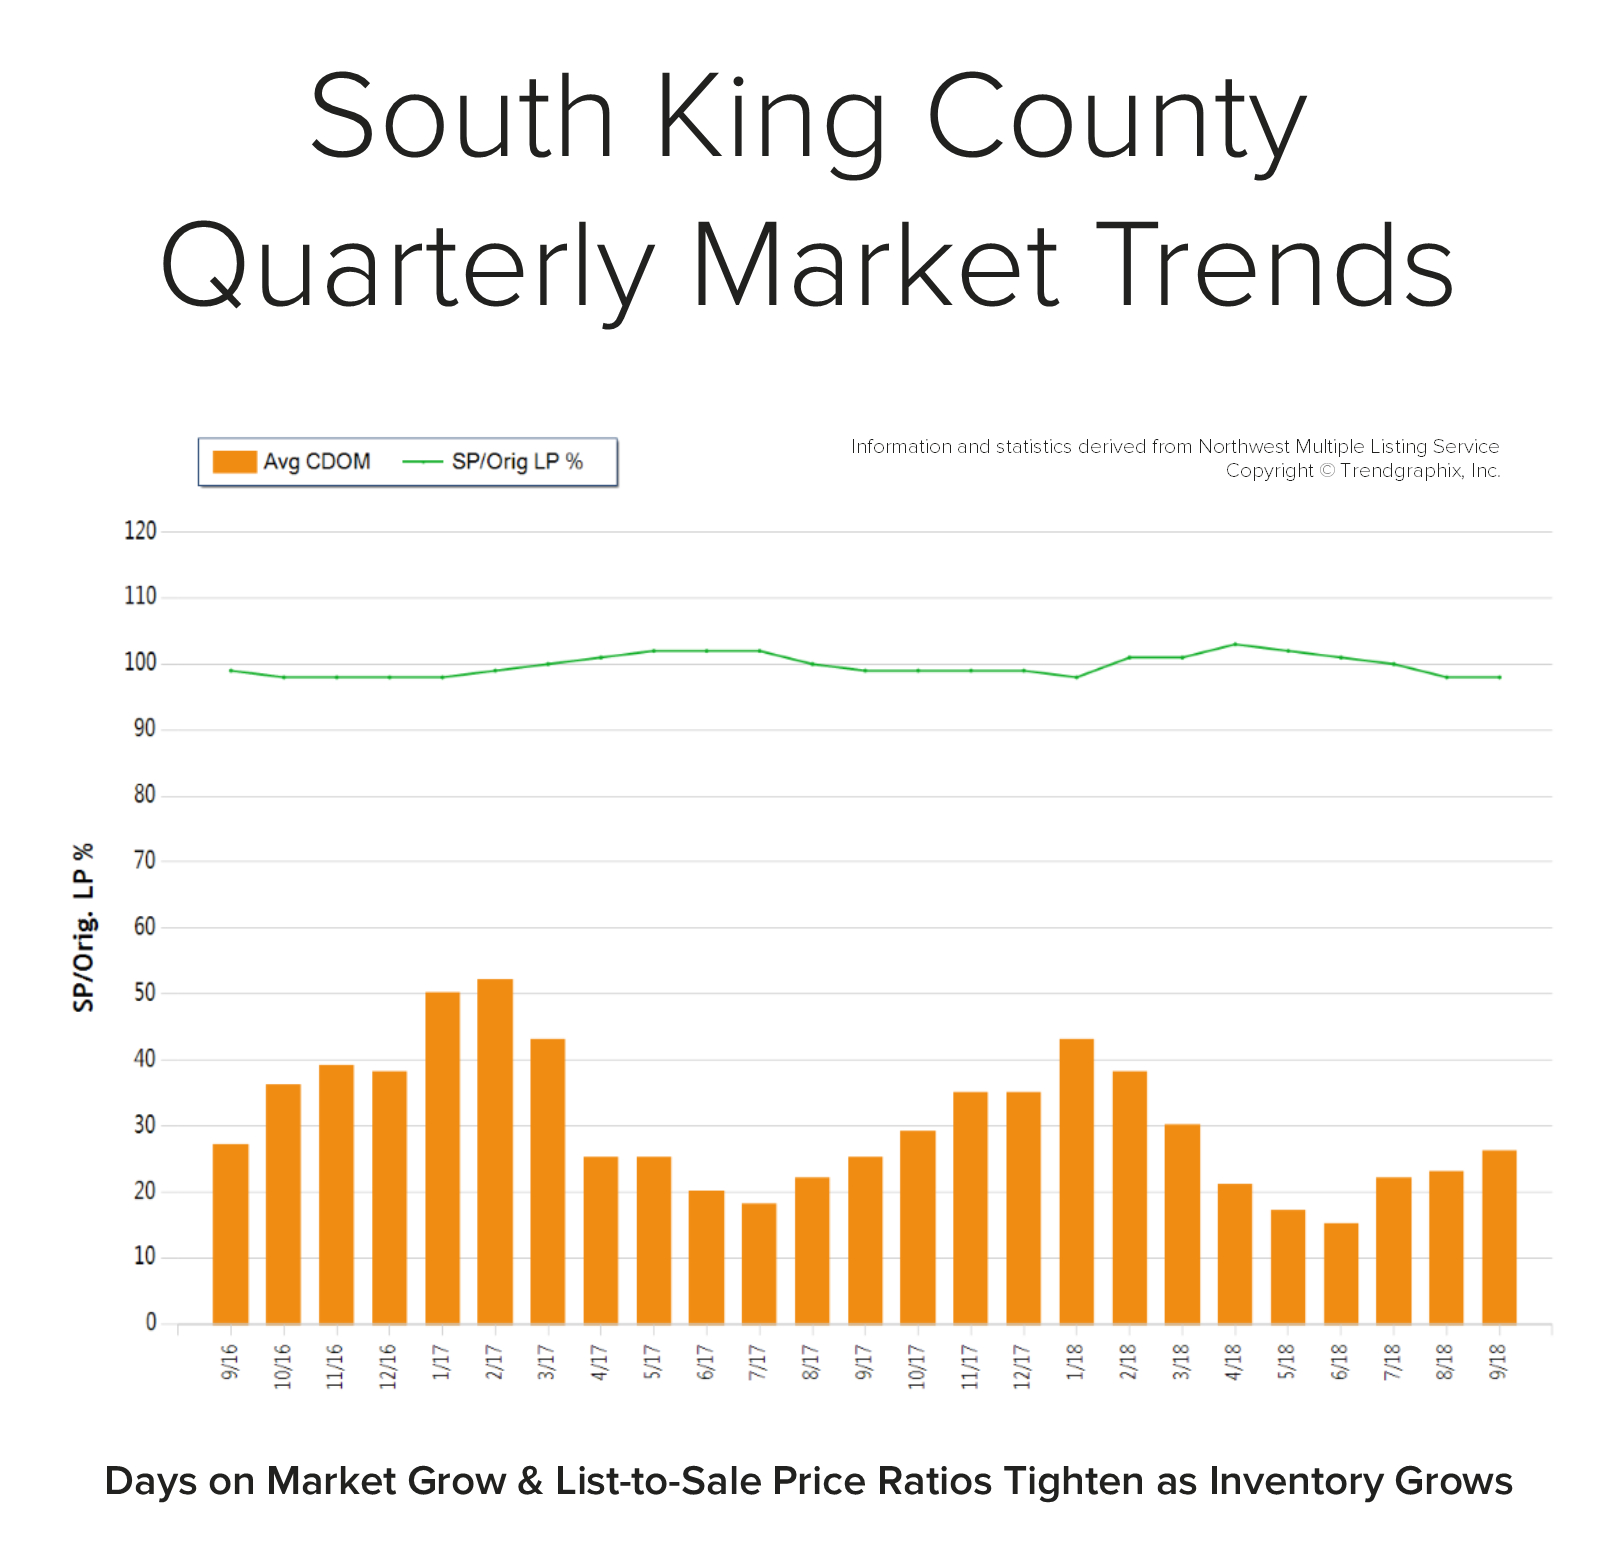
For the first time in years we are starting to see an increase in contingent offers that are turning into pending transactions. A contingent sale is one where a buyer makes an offer to purchase their next home contingent on the sale of their current home. In some cases, the buyer’s current home may be already on the market, or in other cases they still need to launch their home to the market. Many buyers in this situation wait to find a home/seller that is willing to accept their contingent offer, and then they immediately launch their home onto the market.
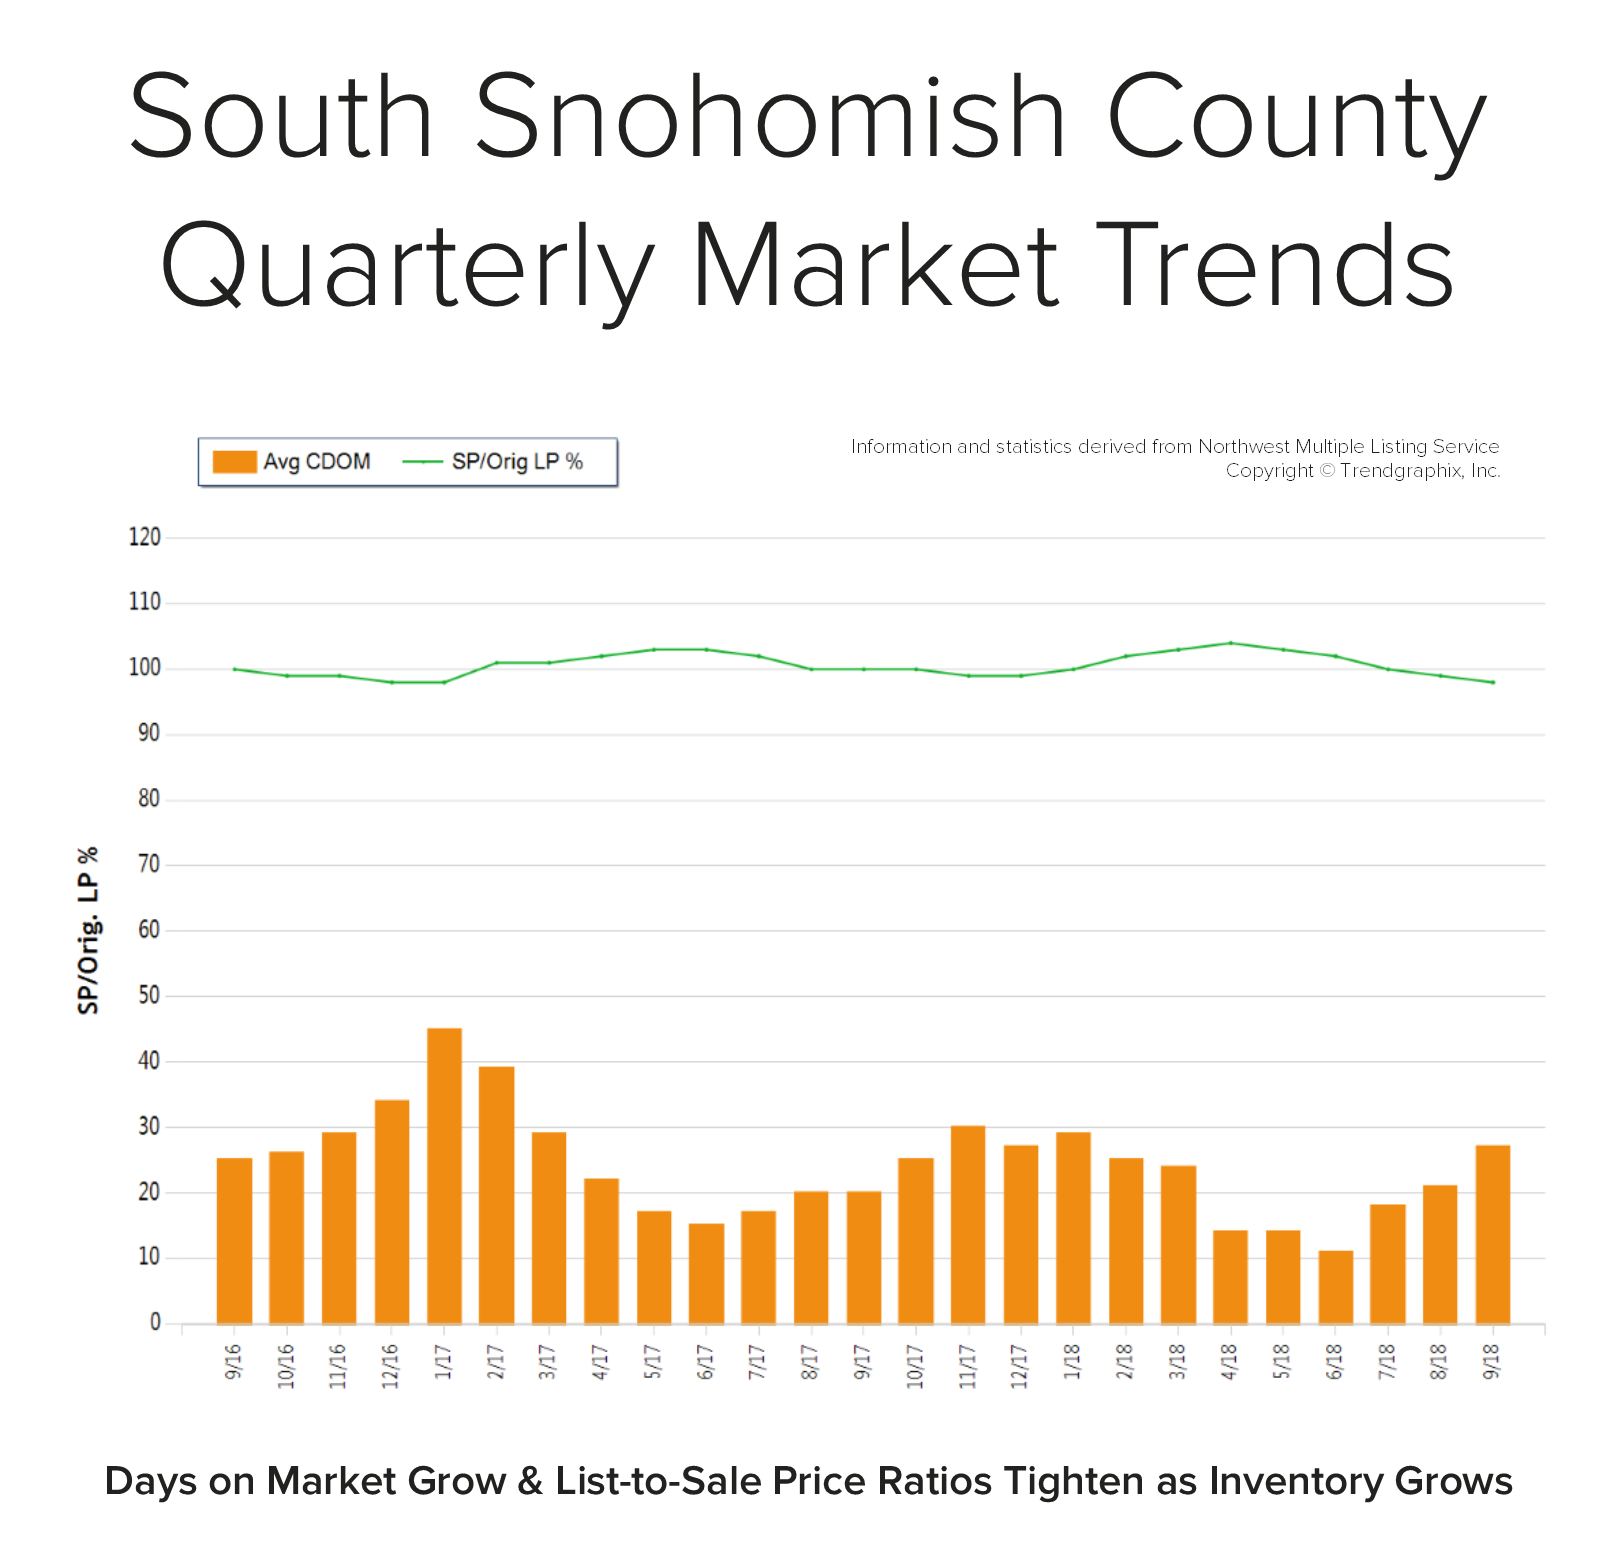
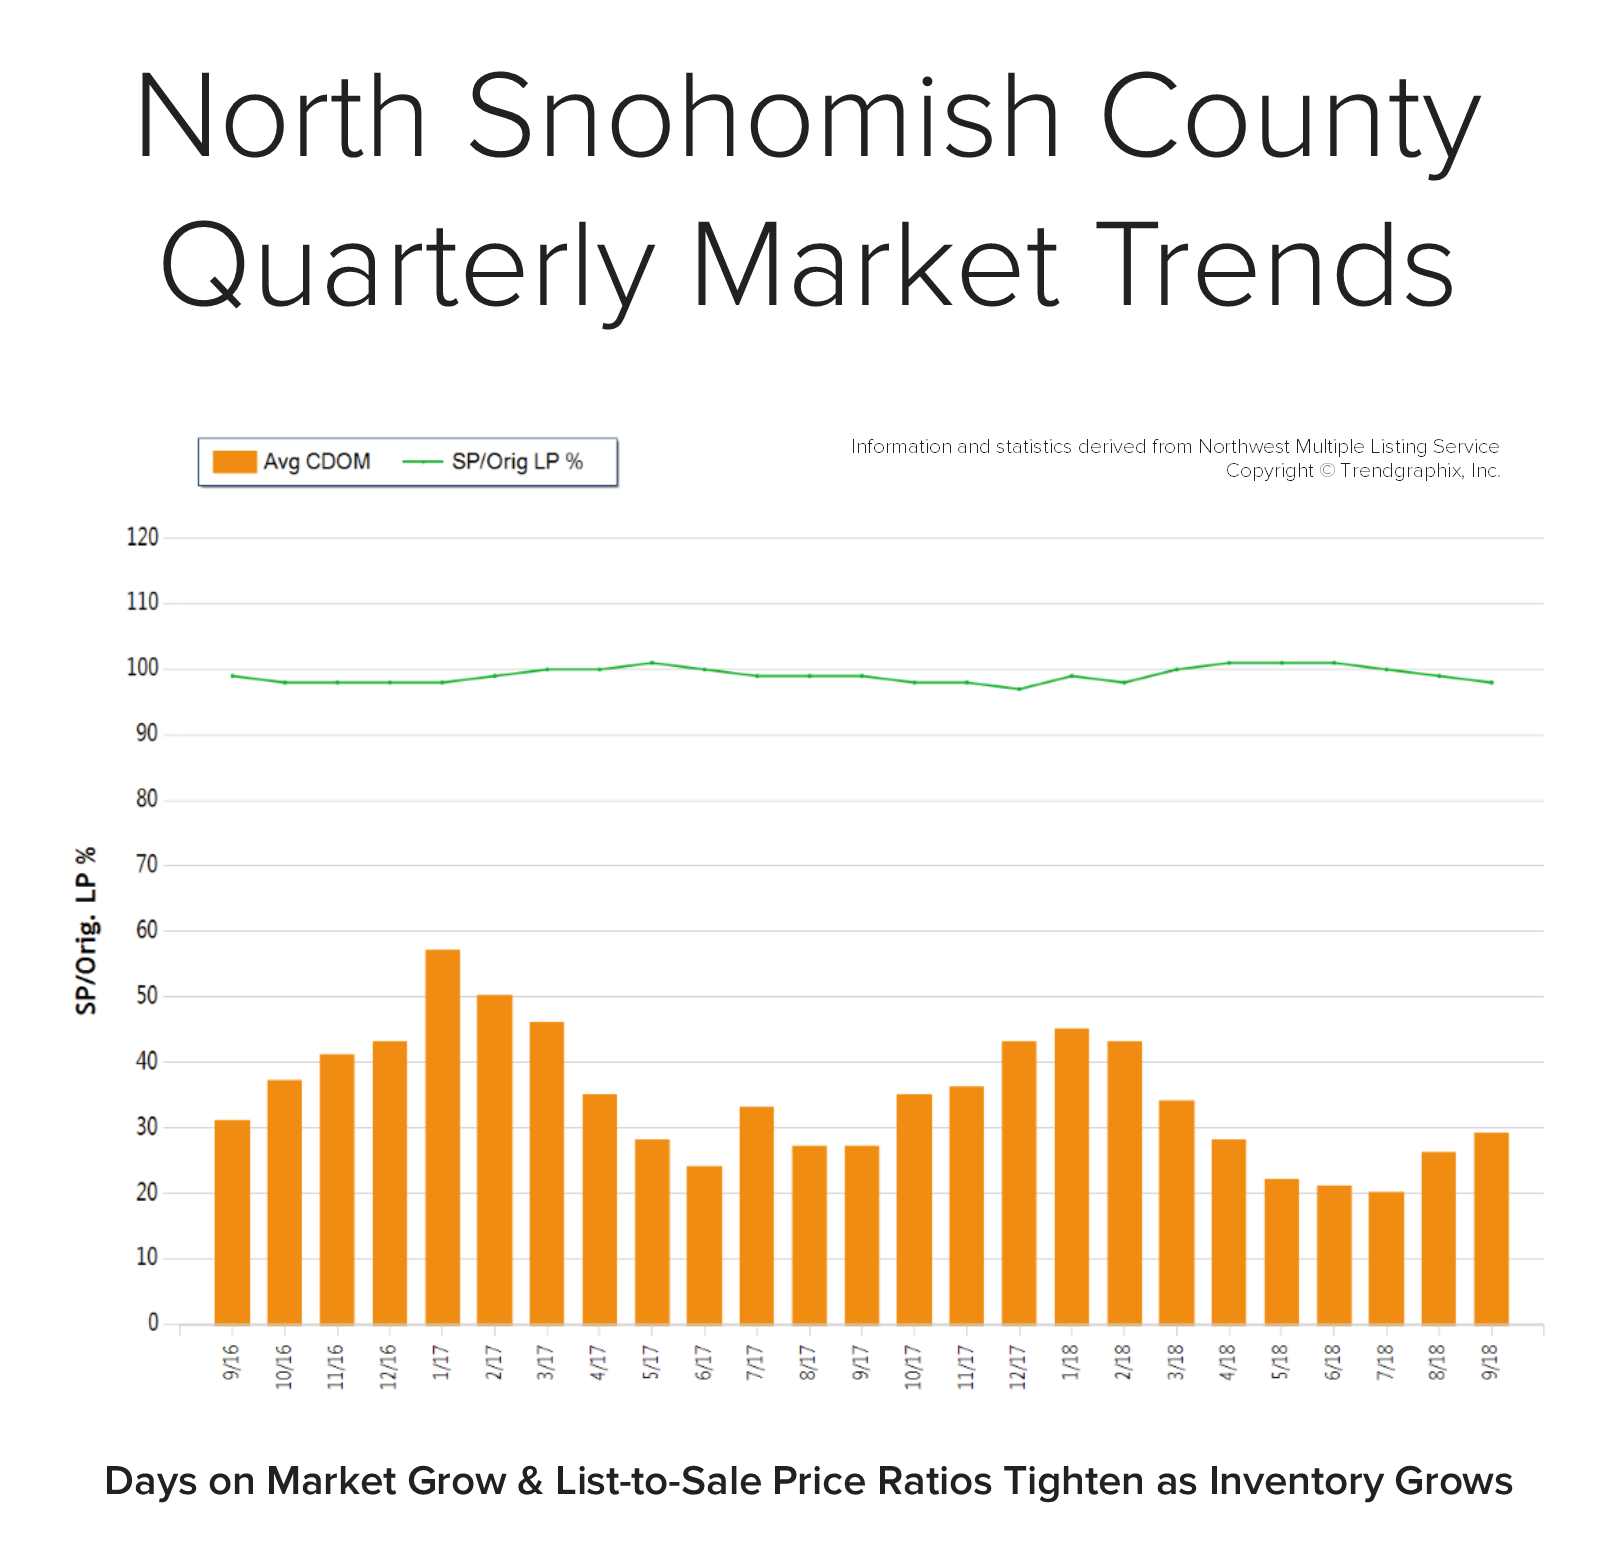
The goal is a sale within 30-45 days, which will then provide the buyer with their down payment funds, and then close both properties within days of each other, making a smooth transition from one house to the next. We have not seen inventory levels the way they are now since late 2014, so the opportunity for successfully executing a contingent offer has not been an option for 4 years! It is a great time to seize this opportunity. With that said, let’s look at some statistics which highlight some of the gains there are to be had.
First and foremost, let’s look at year-over-year price appreciation. Over the last 12 months, we have seen an 11% increase in prices in both King and Snohomish Counties. Last year, the year-over-year price appreciation was 14% for both counties. This illustrates that price appreciation is slowing, or softening, if you will, due to the increase in inventory levels. This is a welcome trend as we move away from unsustainable appreciation levels, which is helping to stabilize affordability. Bear in mind that a historically-normal appreciation rate is 3-5%, so we are still a ways away from reaching that baseline.
The current market environment for both counties is still a seller’s market, sitting at 2.6 months of inventory based on pending sales for King, and 2.3 for Snohomish. A balanced market is representative of 3-6 months on inventory; we are currently just under that, but well above the extreme 0.5-0.8 months that we experienced over the last year or so. This has created more selection, which has minimized multiple offers and given buyers the opportunity to write offers with more comfortable terms, such as a home sale contingency.
Lastly, let’s talk interest rates! Currently, they are hovering around 5%. Yes, this is up from the 4.5% we saw earlier this year, but still well below the 30-year historical average of 6.7%. Money is still relatively cheap to borrow, and this should be taken advantage of as experts predict interest rates to rise as we head into 2019 and beyond. Your interest rate is typically fixed for the life of your loan, so rate plays into the long-term savings you can have on your asset if locked in at today’s levels.
If you have thought about making a move to a home that is a better fit for your current lifestyle, but have been stalled because you weren’t sure how to do it, now is the time to consider your options. Please reach out if you’d like a review of the current market conditions and how they relate to your goals. It is my goal to help keep my clients informed and empower strong decisions.

Choosing a color palette for your home can be a complex process. Whether you are refreshing the interior or exterior, identifying colors that you relate to and that are on trend can be a challenge. Check out this article from House Beautiful on the most popular color palettes for 2019 based on your color personality. I think there is a lot of fun to be had here, and remember – a couple coats of paint can be the most inexpensive way to refresh your home. If you need a painter or any other contractor, remember that I can be a resource, as I have a preferred contractors list that I can pull from.

#TackleHomelessness
Every play matters in the fight against homelessness! Congratulations to the Seattle Seahawks for helping us raise $4,600 to #TackleHomelessness in their last home game against Los Angeles. That brings our season total to $9,200 and our cumulative money raised to $76,000! Good luck to the Hawks this weekend against the Chargers!